As a live streamer who wants to grow their channels and expand their reach, you should pay attention to the performance of your live streams. It takes more than looking at how many views your stream gets to gauge progress — you need detailed metrics that break down how your audience watches and engages with your stream.
Restream Analytics measures your live streaming performance by giving you insights on your stream across multiple platforms. Our helpful multistreaming analytics tool aggregates data from your connected streaming platforms and allows you to compare your performance on each one — all in one place.
With Restream Analytics, you can:
- Know what drives your viewers
- Understand your audience
- Grasp your audience sentiment
Why view aggregate live streaming data?
If each of the channels you’re streaming to already gathers metrics on your live streaming performance, then why bother looking at aggregate data from Restream Analytics?
If you’re a regular multistreamer, visualizing the data from all your platforms can be extremely helpful. You can see how many viewers you had in total or which channel had the most total watched minutes. These valuable insights can help you make decisions about how long to stream, what time of day to go live, and which channels to broadcast to.
How to use Restream Analytics
Restream Analytics is fairly intuitive, and we’ve made the data easy to read and understand. You can also view it all in your Restream account.
Start by logging into your account, then clicking on the three dots on the sidebar for “More.” Next, click on “Analytics” and you’ll see your Analytics Overview. To the left, you’ll see a column with all your streaming analytics, including Stream Metrics, Chat, and Audience. Let’s look at the overview and each of these categories in more detail.
Overview
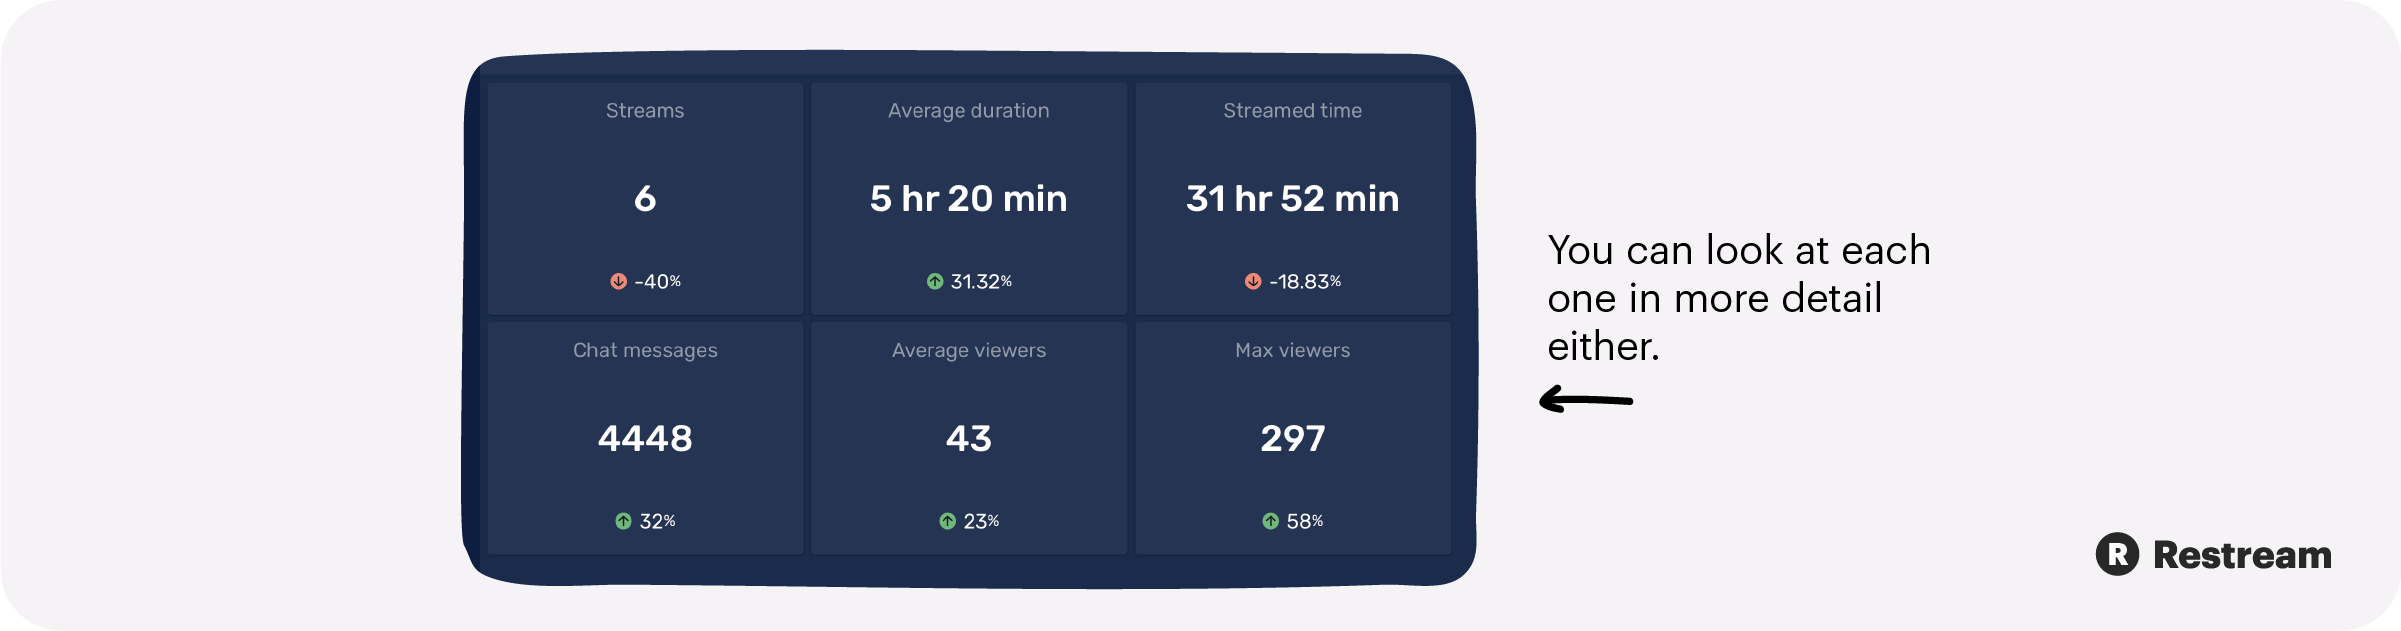
When you’re looking at the Overview on Restream Analytics, you’ll see six major metrics, divided into six cards:
- Streams
- Average duration
- Streamed time
- Chat messages
- Average viewers
- Max viewers
These metrics give you a quick snapshot of your recent streaming analytics. You can look at each one in more detail by hovering over a card and clicking the arrow that appears in the top right-hand corner. You can also navigate to each one using the sidebar menu on the left.
Stream sessions
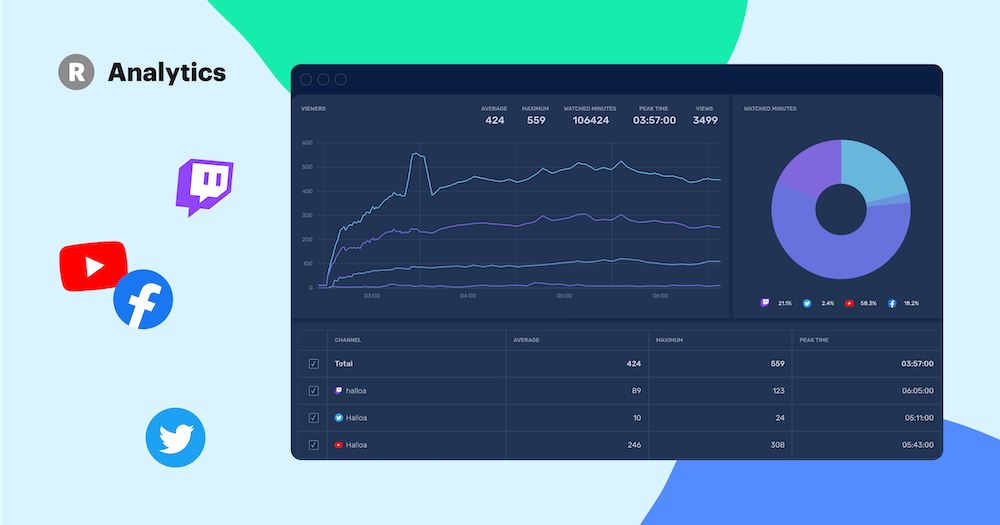
After the Overview, the next section is stream sessions. At the top of your Last Session page, you’ll see the date of your most recent live streaming session and how long it lasted. Below that, you’ll also find two charts that show your viewers and watched minutes. The viewers chart is broken down by your channels; aggregated values for average viewers, maximum viewers, watched minutes, peak time, and total views are displayed on the top right corner of the chart.
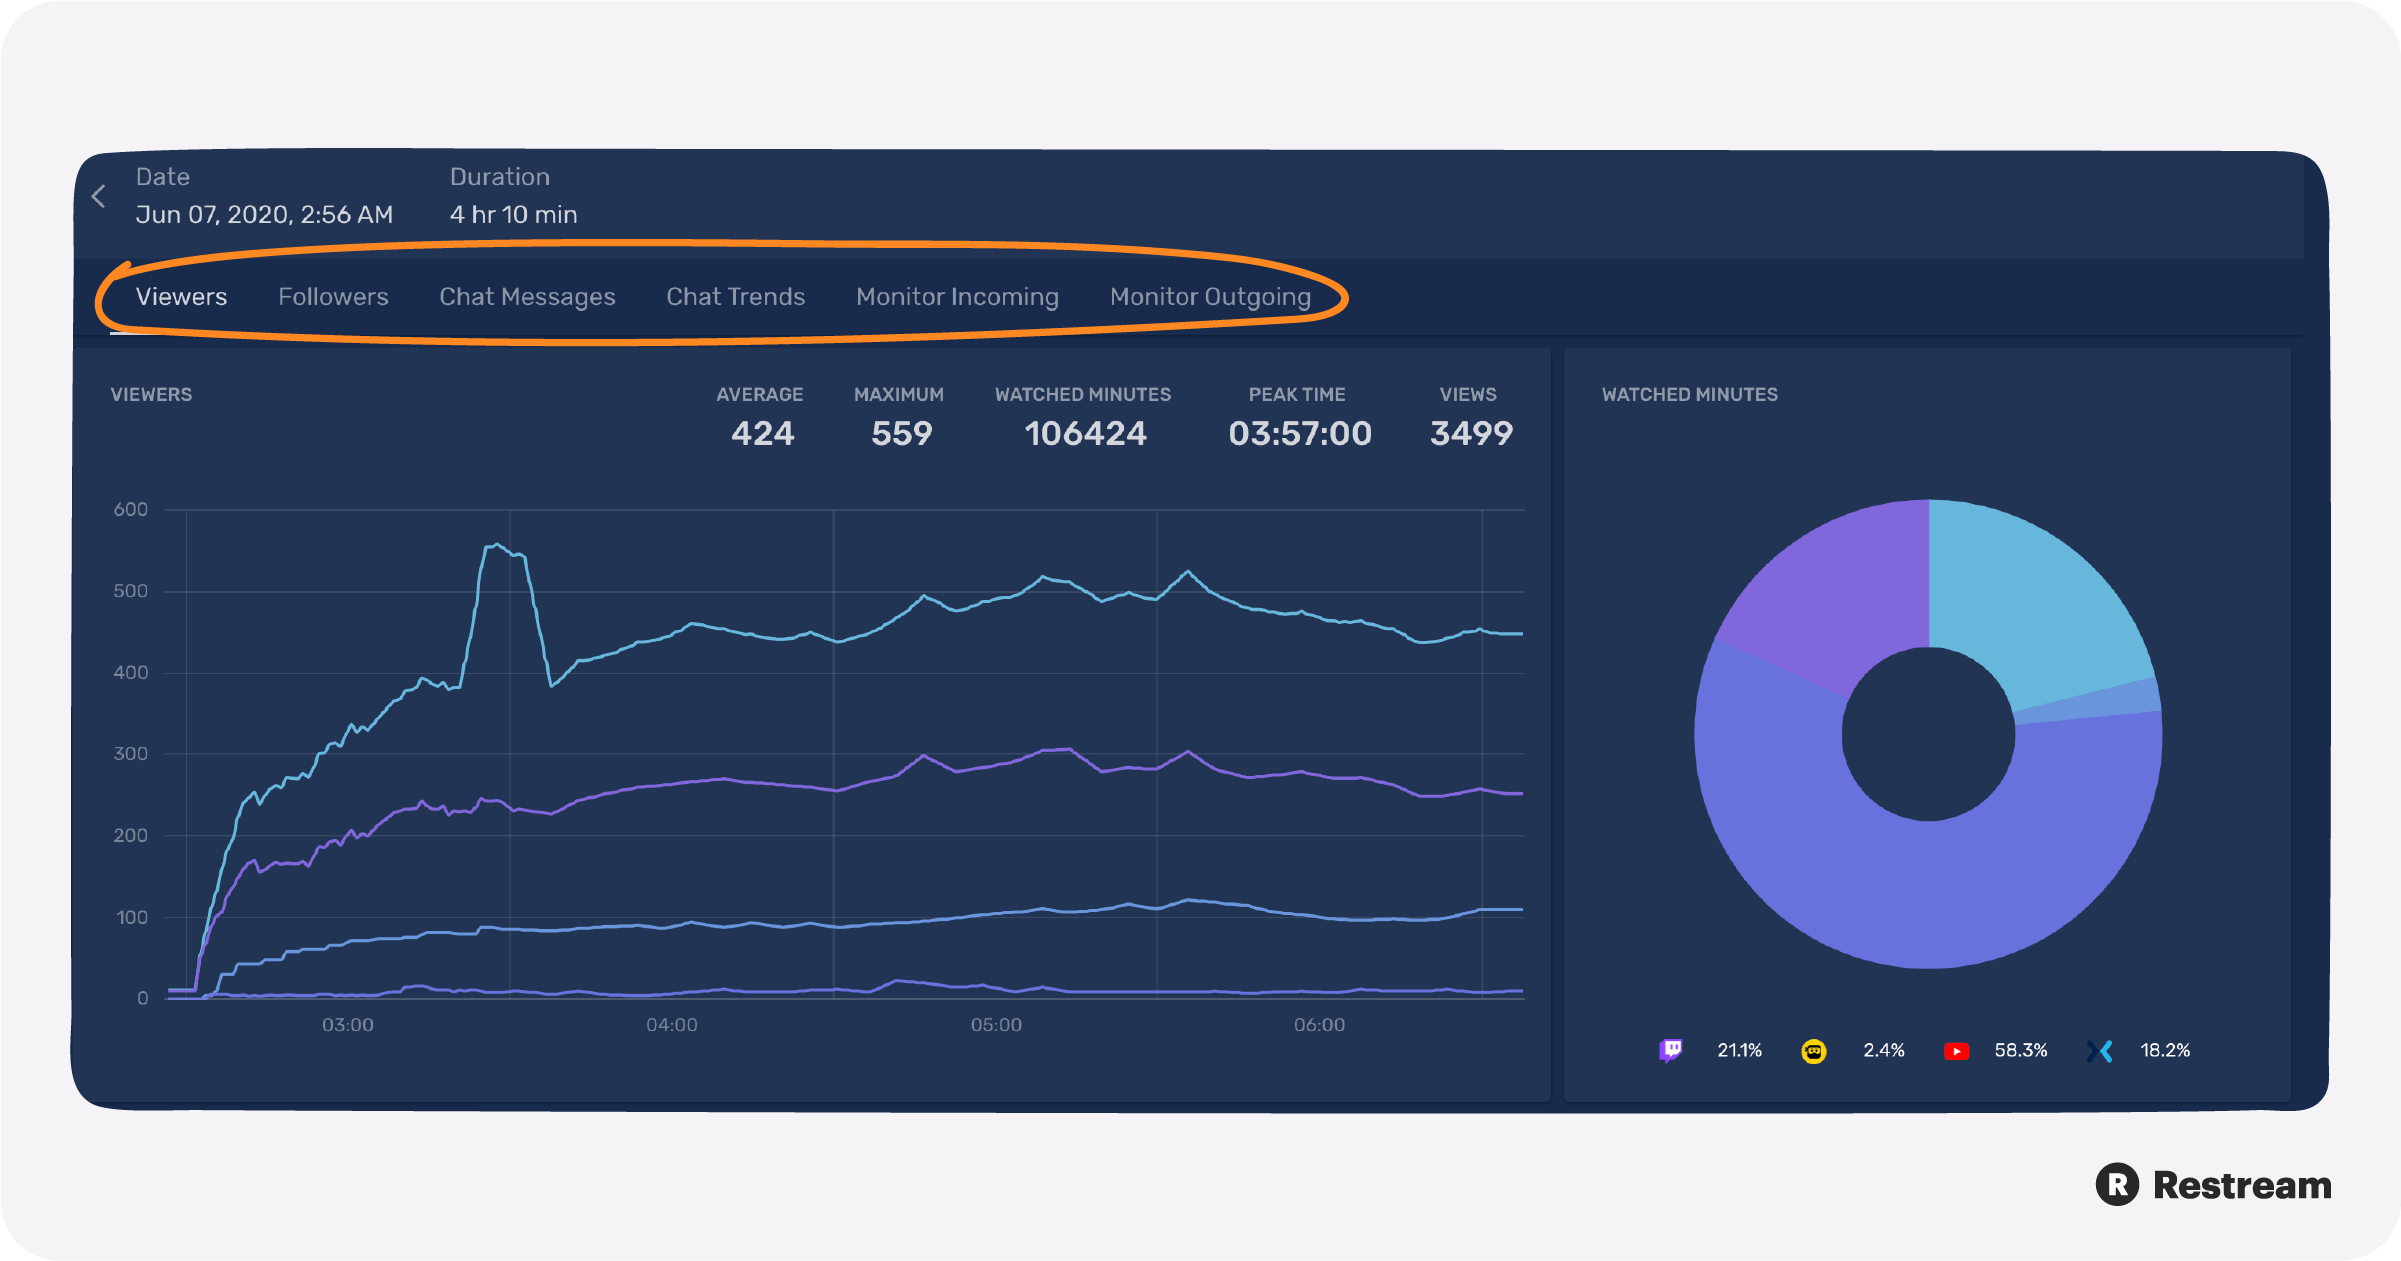
For your most recent stream, you can view data on the following:
- Viewers: Check how many viewers you had during a single stream, watched minutes, how many viewers you had at your peak (greatest number of viewers), and total views throughout the stream.
- Followers: See how many followers you had during the stream, new followers gained during the stream, and your follower growth rate.
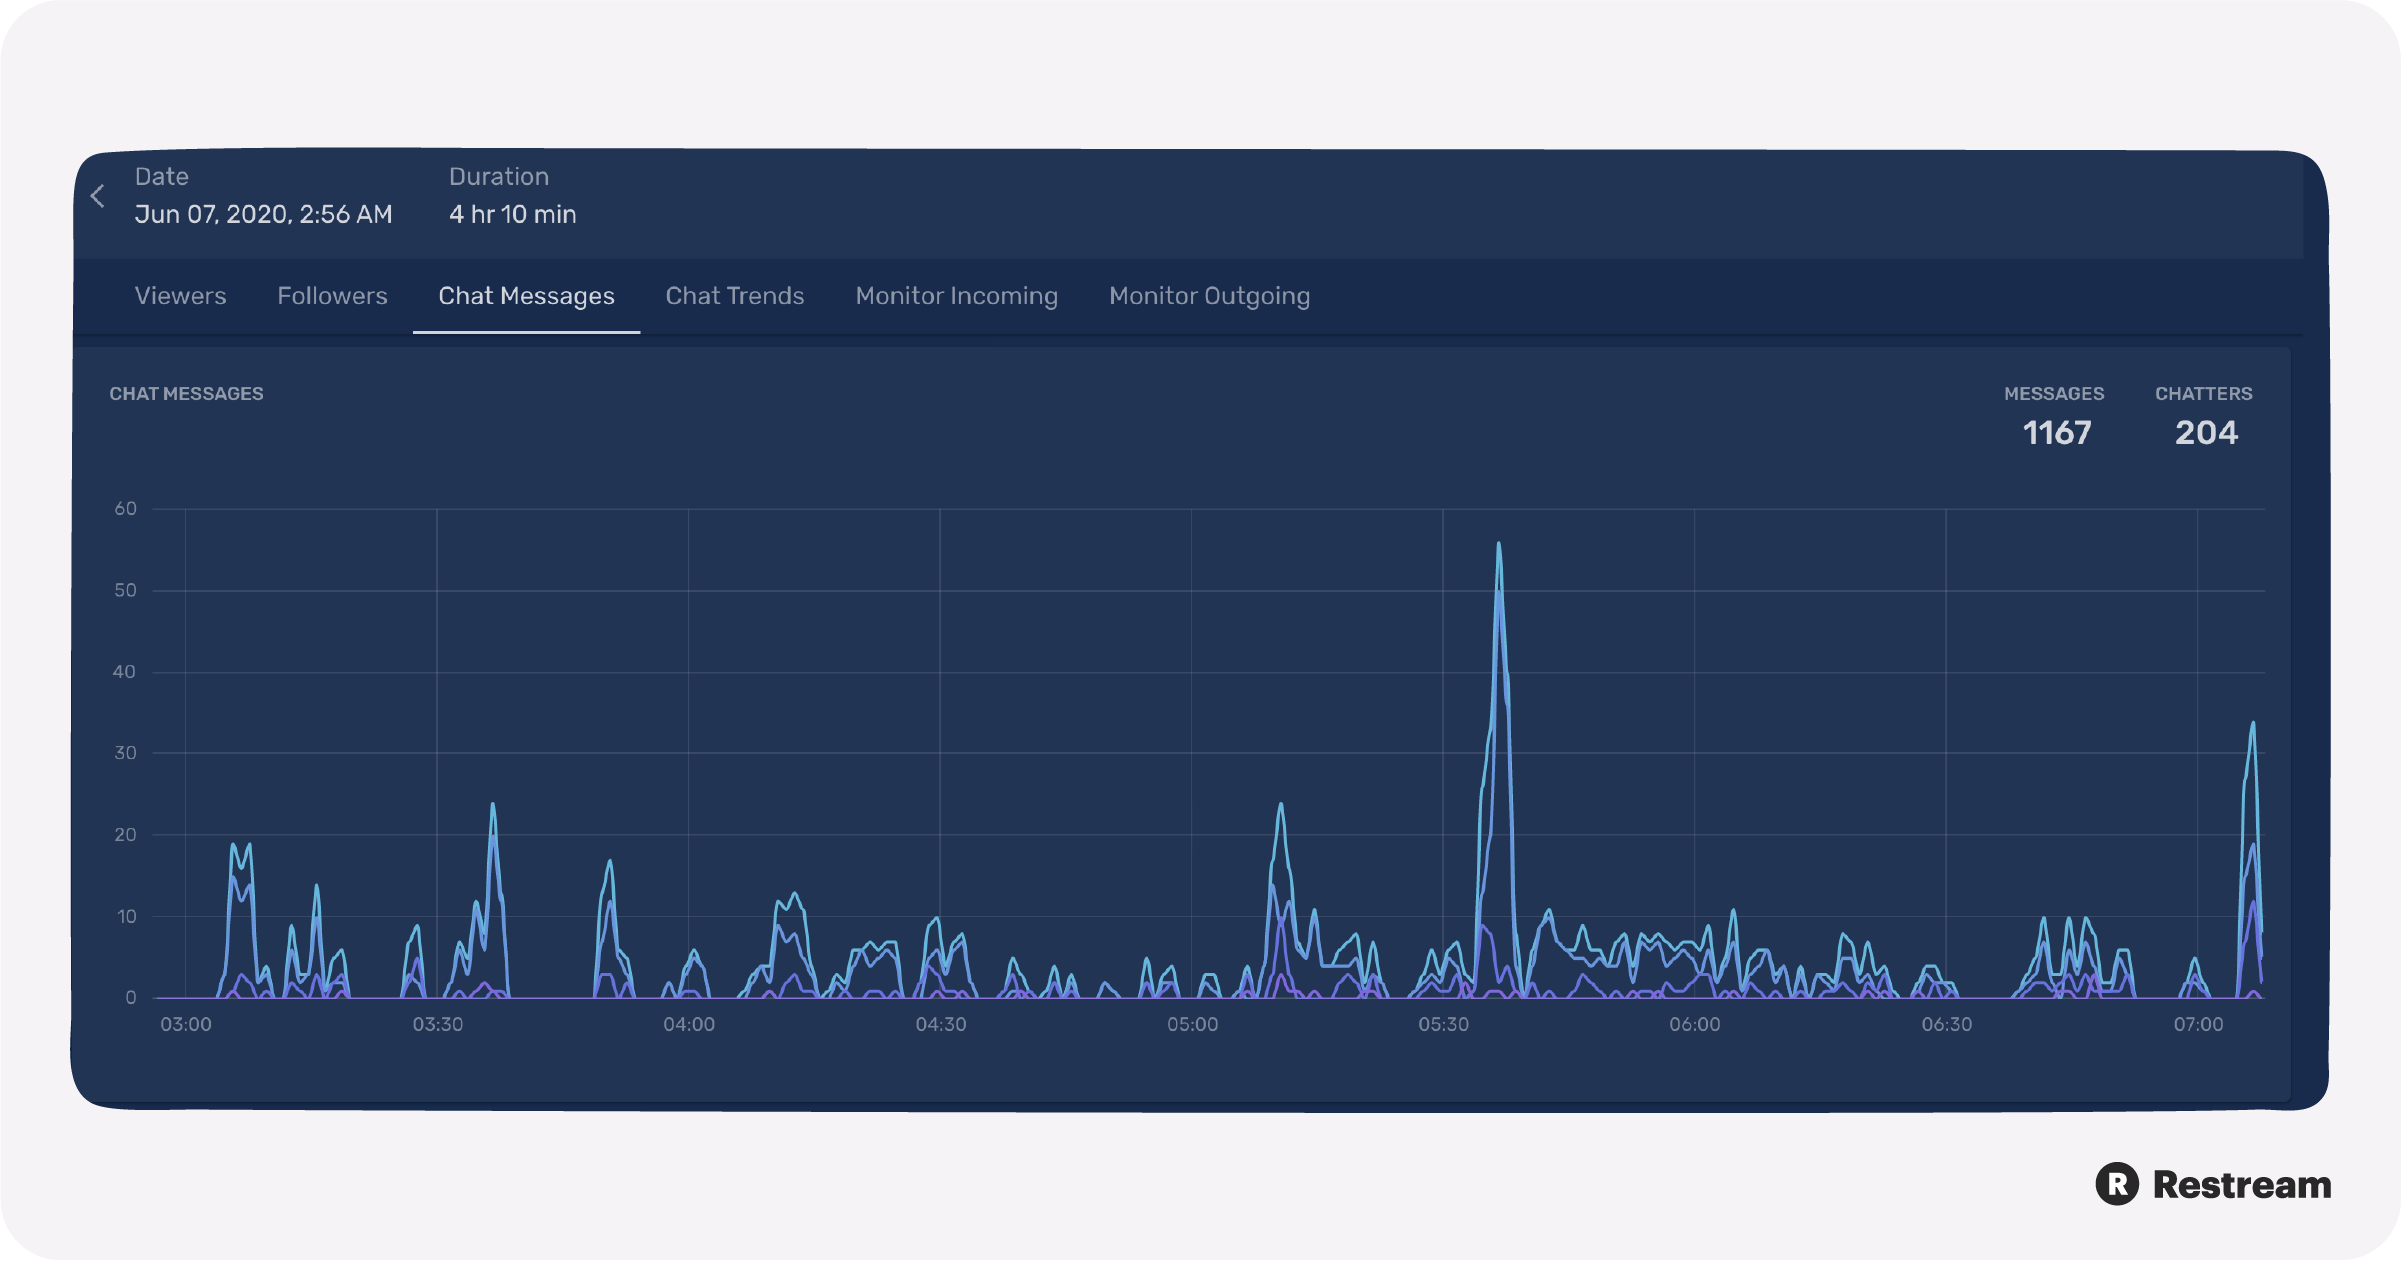
- Chat Messages: See total messages sent during the stream and the total number of chatters who participated.
- Monitor Incoming: Check your stream’s incoming bitrate and frames per second (FPS), along with related metrics at the bottom.
- Monitor Outgoing: See your stream’s outgoing bitrate and buffer size, along with bitrate, successful starts, restarts, and max buffer size for each channel at the bottom.
For each of the categories above except Monitor Incoming, you can see the data broken down by channel, at the bottom of the screen.
When you navigate to All Sessions, you’ll see a list with one entry for each time you streamed. You can view more detailed metrics on each stream by clicking on it. In addition to looking at all the stream, chat, and audience data of one session, you can look at these specific metrics in more detail. We’ll go over what these categories mean and how to use them in the following sections.
Stream metrics
In the sidebar menu on the left, navigate to Stream Metrics. You’ll see streams, average duration, and streamed time.
1. Streams
On the Streams page, you’ll see a graph visualizing the number of streams you’ve broadcasted with Restream. The Most Loaded Period chart on the right shows what time of day and day of the week you most commonly stream. This information is important if you intend to stream regularly.
2. Average duration
The average duration is calculated with all of the streams you’ve broadcasted to Restream and is visualized in a graph.
3. Streamed time
Rather than showing the average time you spend streaming per session, the streamed time is a total count of all the minutes or hours you’ve streamed using Restream.
For each of these metrics, you can look at a specific time period by selecting a date range at the top of the page. You can choose to view data from the past week, past four weeks, past 12 weeks, or past 24 weeks.
When you want to put data from your chat and audience into context, it’s good to know how your stream metrics play a role. If you see the average duration of your stream increased in the past 12 weeks, it might help explain your decrease in average viewers per stream.
Chat
To collect chat data, you need to use Restream Chat and have it running while you live stream. You can read our Restream Chat guide to learn how to install and use Restream Chat.
The available metrics under chat are messages, chatters, and chat trends.
1. Messages
In this section, you can view the total number of chat messages sent over a period of time. The messages are broken down by channel at the bottom of the page. If you want to see the total number of messages for a single stream, you’ll have to navigate to “All sessions,” click on the stream, then click “Chat Messages” from the menu near the top.
2. Chatters
In the Chatters section, you’ll see the unique number of viewers who sent at least one message to the chat during your live streams, over a set period of time. Again, if you want to view chatters for a single session, find the session in “All Sessions,” then navigate to “Chat Messages” to see it.
For all of these chat metrics, you can change the period of time you’re looking at from the past week, past four weeks, past 12 weeks, and past 24 weeks.
Keeping an eye on your chat metrics is important if you’re concerned about engagement. Having an active chat shows that not only are people watching your stream, but they’re also commenting on it and connecting with other viewers.
Audience
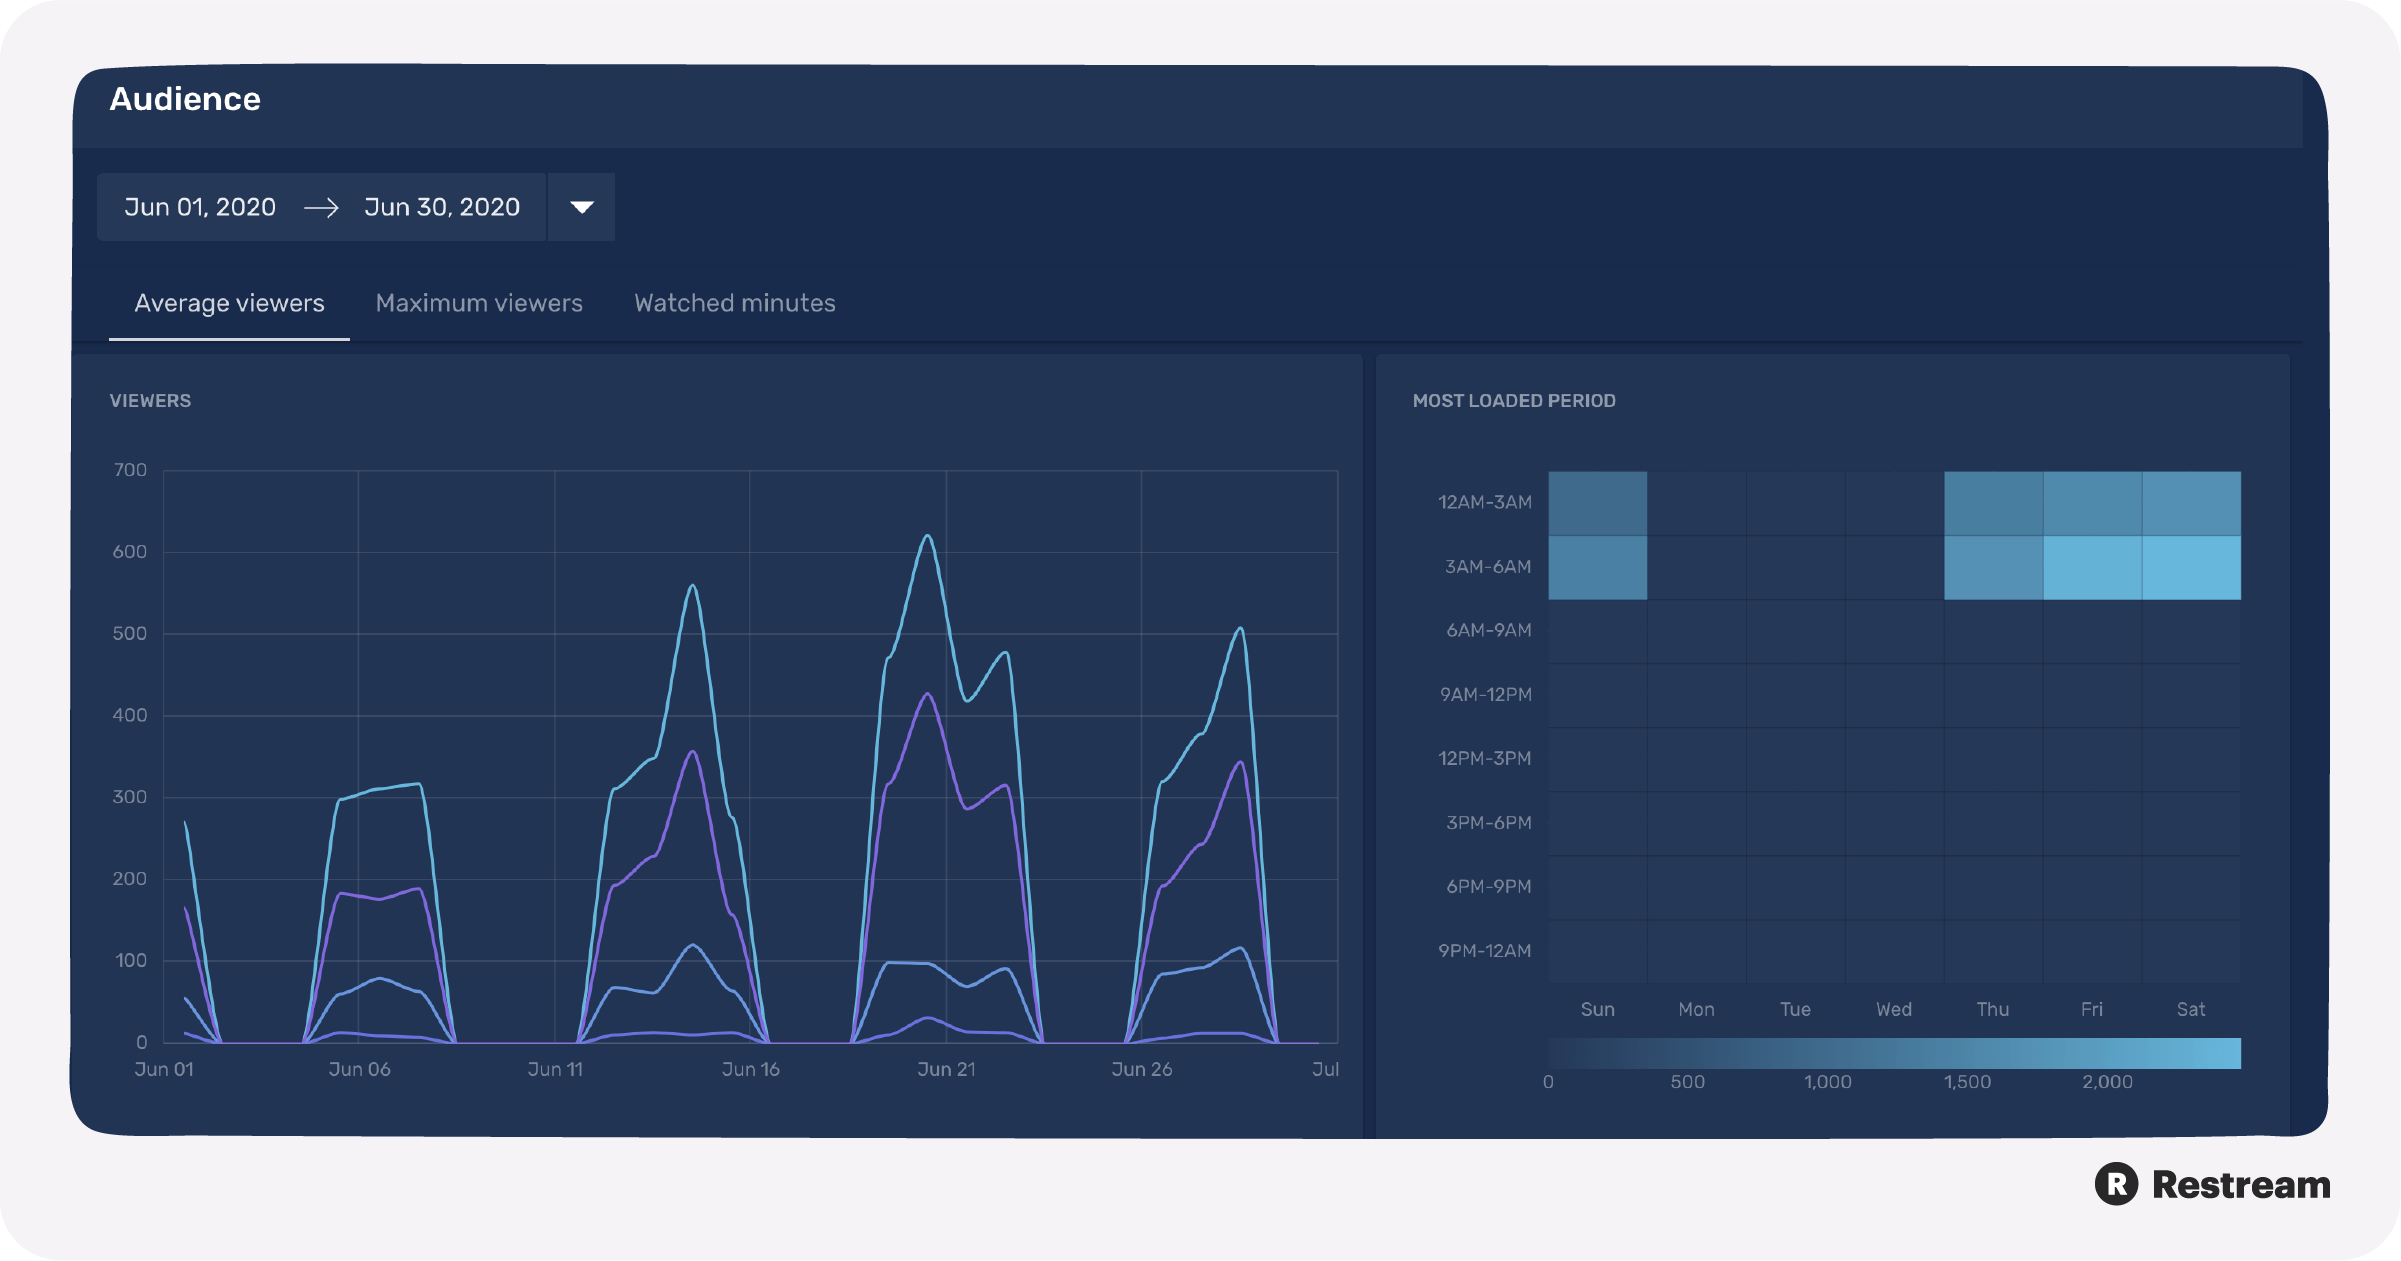
Under the Audience category on the left-hand Analytics menu, you can look at average viewers, max viewers, and watched minutes.
1. Average viewers
Your average viewers are the average number of concurrent viewers watching your streams over a period of time. The concurrent viewer count is the number of users watching your stream at a given second. The concurrent viewer count fluctuates as users join or leave your stream.
2. Maximum viewers
The maximum viewer count is the greatest number of viewers you had during your streams over a period of time. The moment(s) during your stream at which you have the highest number of viewers is your peak time.
3. Watched minutes
The watched minutes metric shows how many minutes of your stream were actually watched by viewers. Watched minutes equals average viewers times session duration. If you want to see watched minutes over several streams, you can select a time period from the top of the page and it will calculate watched minutes as average viewers times total streamed time in that specific time period.
Platforms that support Restream Analytics
Not every platform that supports multistreaming with Restream supports Restream Analytics. Check the below list to see if your favorite platform supports major Restream Analytics functions.
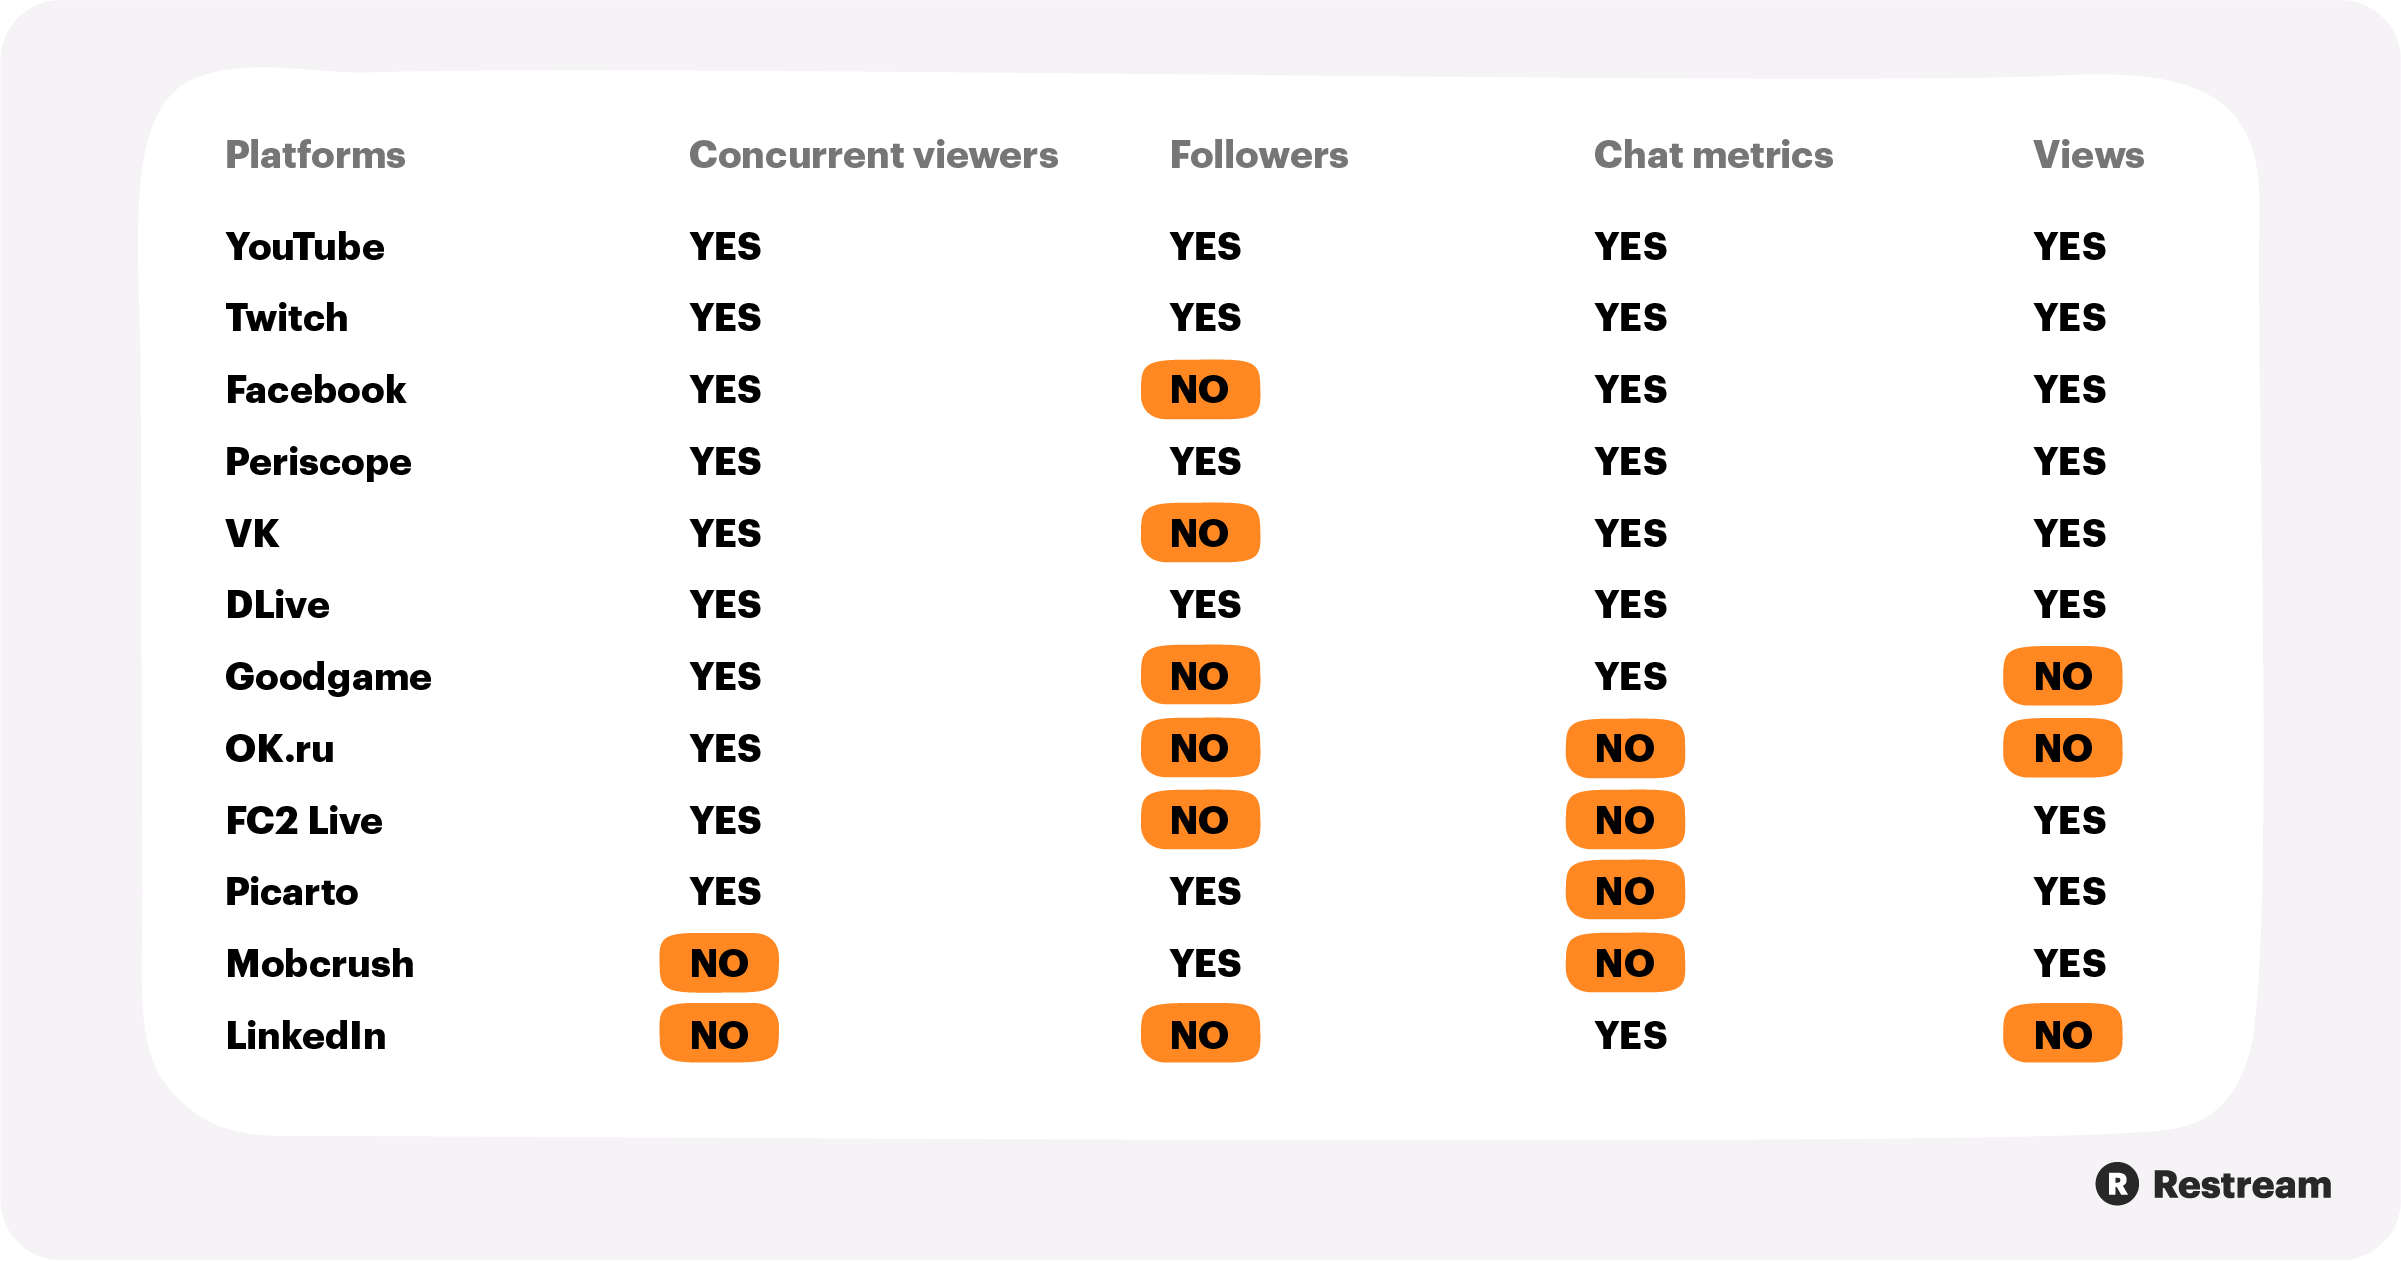
You should also know that some metrics might differ between Restream Analytics and the end platform’s analytics. For example, average viewers on Twitch or YouTube might differ from average viewers in Restream Analytics. We pull data from these end platforms every few seconds, so the calculations for our metrics might differ from those of the end platform.
Why your live stream analytics matter
Why bother with your live stream analytics? Is this data really helpful to you as a streamer? Of course! If you’re looking to grow your channel or live streaming brand at all, you have to pay attention to the numbers. Your viewers, followers, watched minutes, chat messages, and other metrics paint a picture of your viewer engagement and overall success as a live streamer.
Restream Analytics provides you with a ton of data to track your progress. What are the key metrics to watch when it comes to gauging the results of your live streaming efforts?
- Concurrent viewers at peak time: Concurrent viewers are the number of people watching your live stream at the same time. Concurrent viewers is a metric unique to live streaming — you can’t measure how many people are watching an on-demand video at the same time. Concurrent viewers at peak time (the most viewers you had for a stream) is the best measure of live streaming viewership.
- Watched minutes: To know how well you hold viewers’ attention, look at watched minutes. Few viewers will tune into your stream for the entire duration. But if you can get an average watch time of around 30 percent — meaning the average watch time of all your viewers was equal to 30 percent of the length of your stream — you’re doing well.
- Bitrate: Bitrate refers to the video data transferred at a given time. The more bits you transmit per second, the higher the quality of your stream. To have a high bitrate, you need a strong internet connection. Stream quality is important because you want to give your viewers the best experience possible; low viewership might be explained by a low bitrate. Keep an eye on your bitrate and other performance metrics that measure the quality of your live stream.
Let’s wrap up
Restream Analytics is a powerful resource that empowers you to improve your live streaming performance by providing crucial streaming data. You have access to meaningful metrics such as:
- Average duration
- Streamed time
- Chatters
- Chat messages
- Maximum viewers
- Watched minutes
- Followers
- Growth rate
And most importantly, you can view all this data from across the multiple channels you broadcast to, either aggregated or by channel. With these performance metrics, you’ll have all the information you need to expand your reach as a live streamer.